Data app visualizations let you create custom chart types from a prompt. Describe the visualization you want - a calendar heatmap, a hexbin map, a custom KPI layout - and Lightdash generates it. From then on, anyone in the project can use it like a built-in chart type. A visualization is a special kind of data app: a single-tile chart renderer. Unlike a full data app, which owns its own queries and pages, a visualization declares a set of typed fields it needs (for example, a “Category” dimension and a “Value” metric) and Lightdash feeds it data from whatever query it’s attached to. The same visualization can power many saved charts, each with its own query and field mapping.
Data app visualizations require data apps to be enabled on your instance. Data apps are enabled by default on Lightdash Cloud; on self-hosted enterprise instances, see Self-hosting Data apps.

Creating a visualization

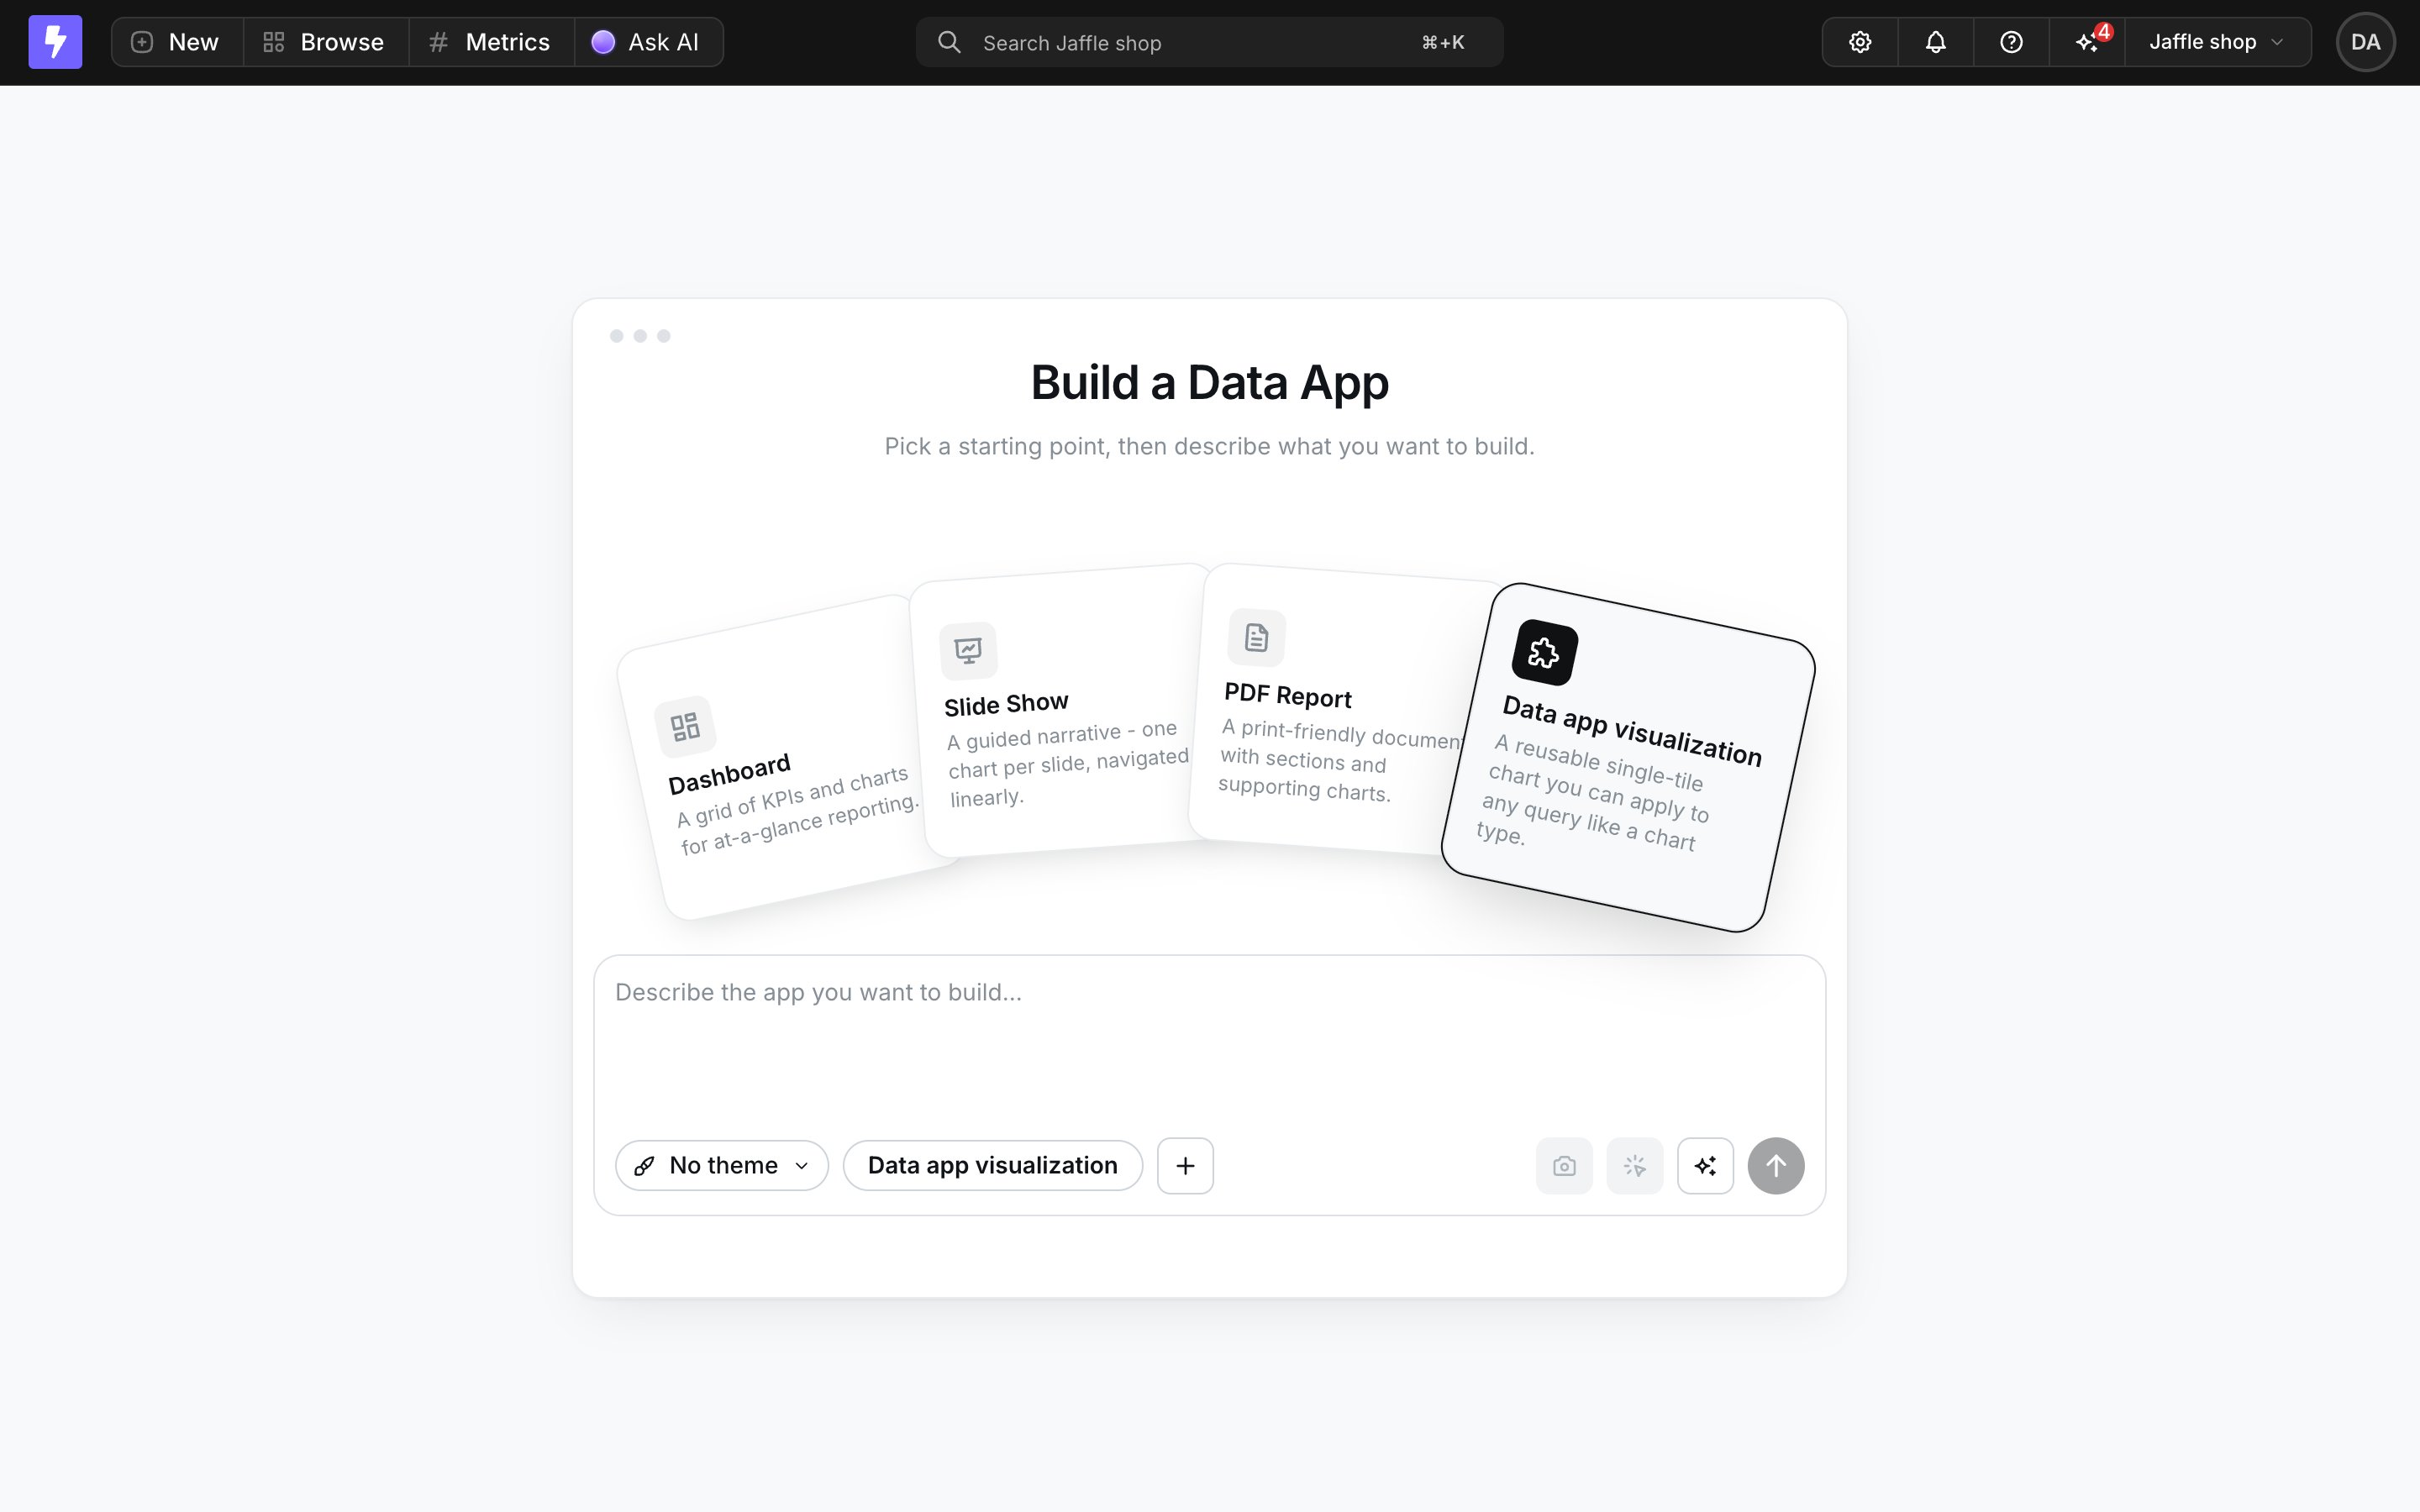
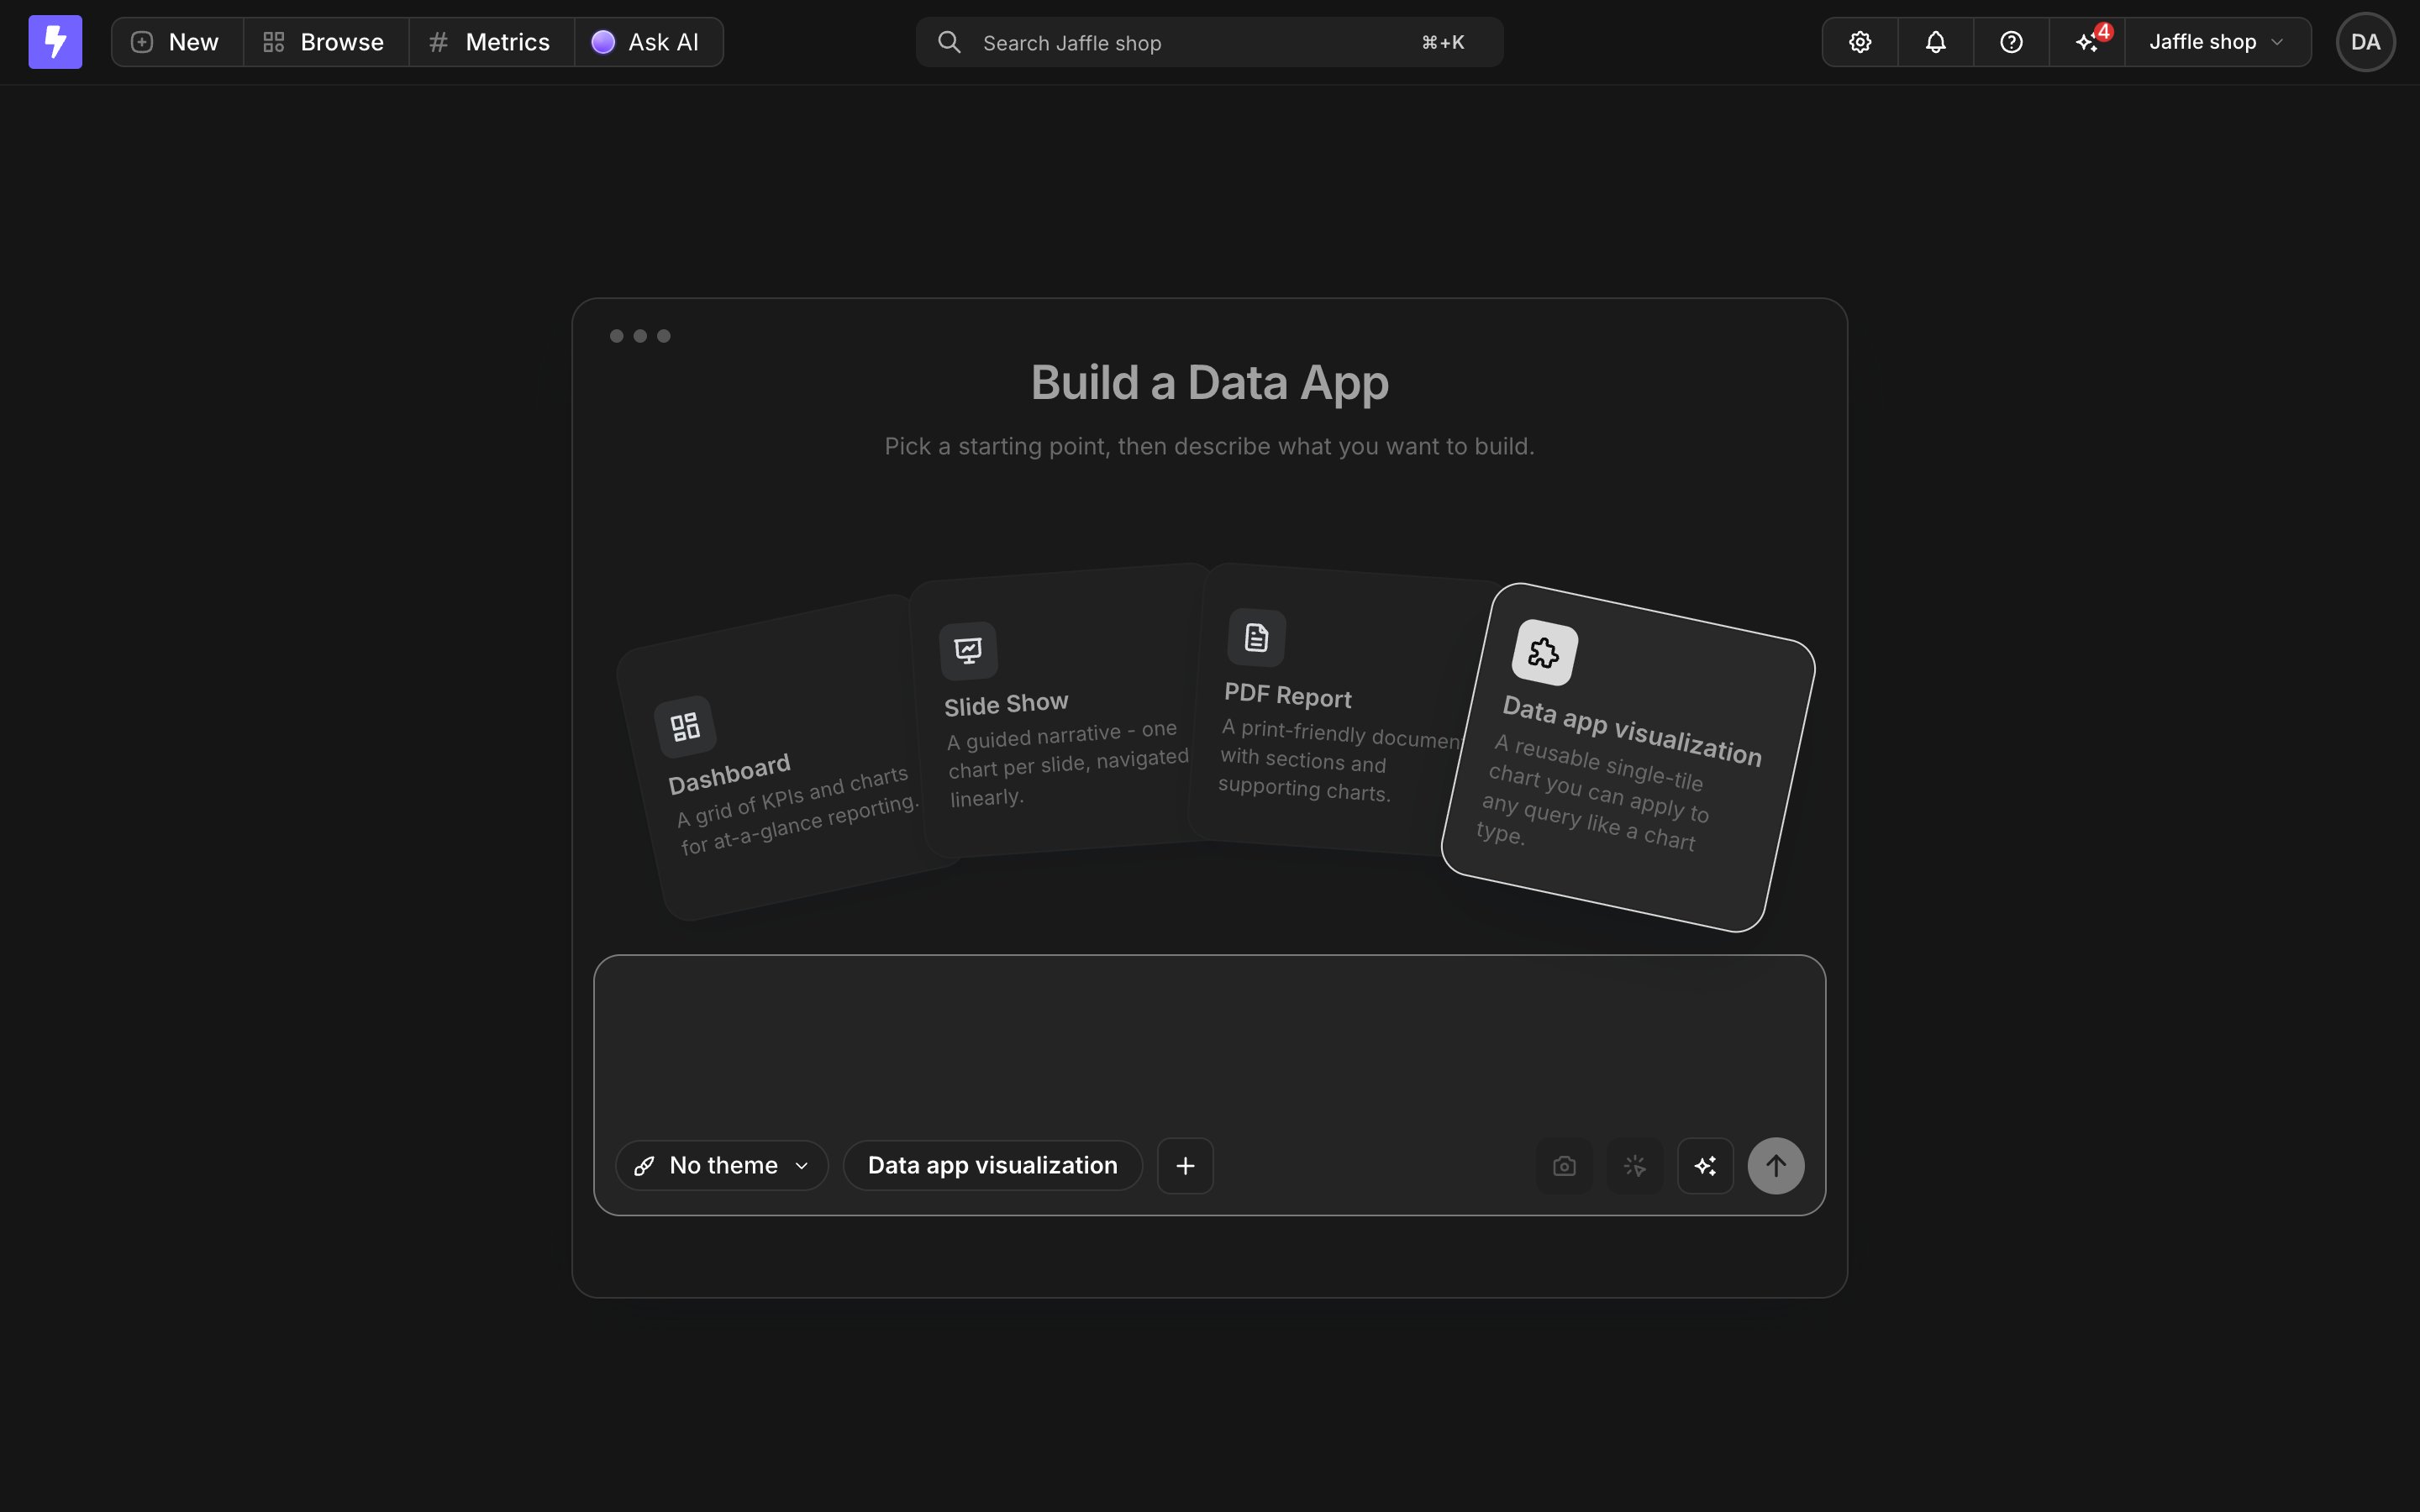
You create a visualization from the app generator, the same place you create any other data app:
  1. Go to Apps and start generating a new app (/apps/generate).
  2. Pick the Data app visualization template card.
  3. Describe the visualization you want in the prompt.
The Data app visualization template card in the app generator
The AI generates the chart renderer along with a declared field schema - the list of data inputs the visualization needs, such as a “Category” dimension and a “Value” metric. Each field is typed as a dimension, a metric, or a series. When generation finishes, a Visualization ready result card shows the declared fields with their types, using the same dimension and metric colors as the rest of the app. You iterate on a visualization the same way you iterate on any data app: follow-up prompts create new versions, and you can restore earlier versions from the timeline.

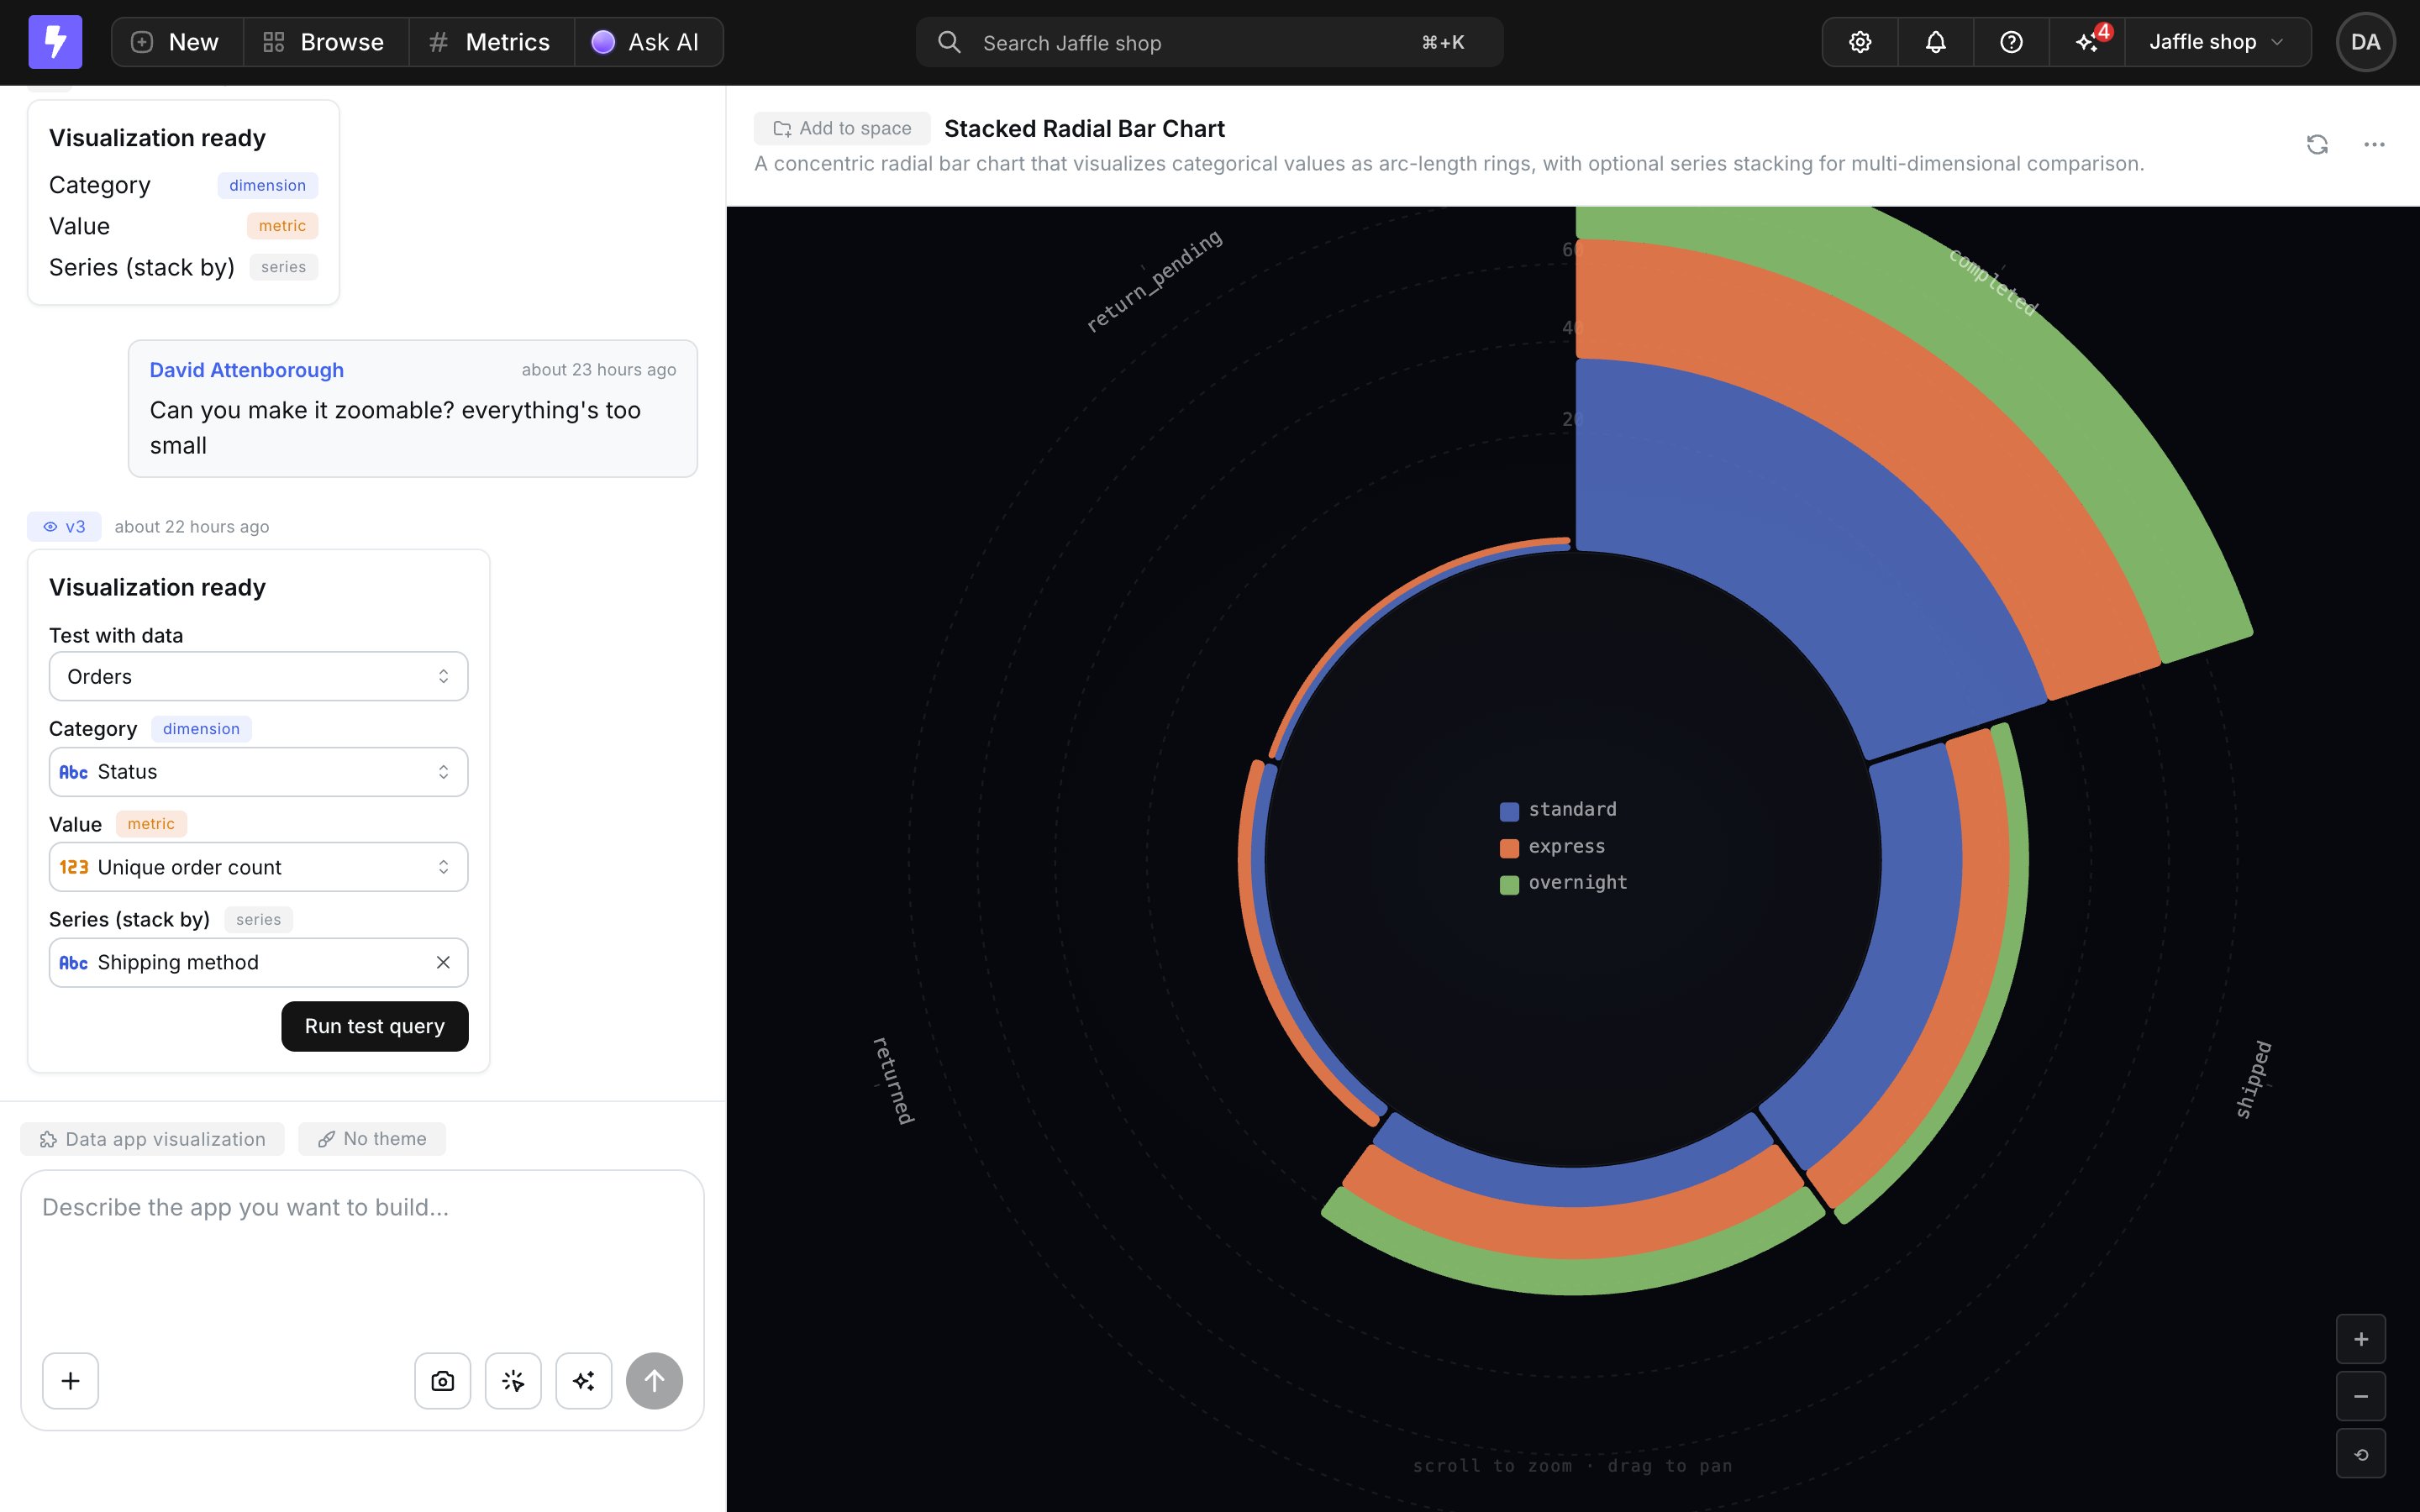
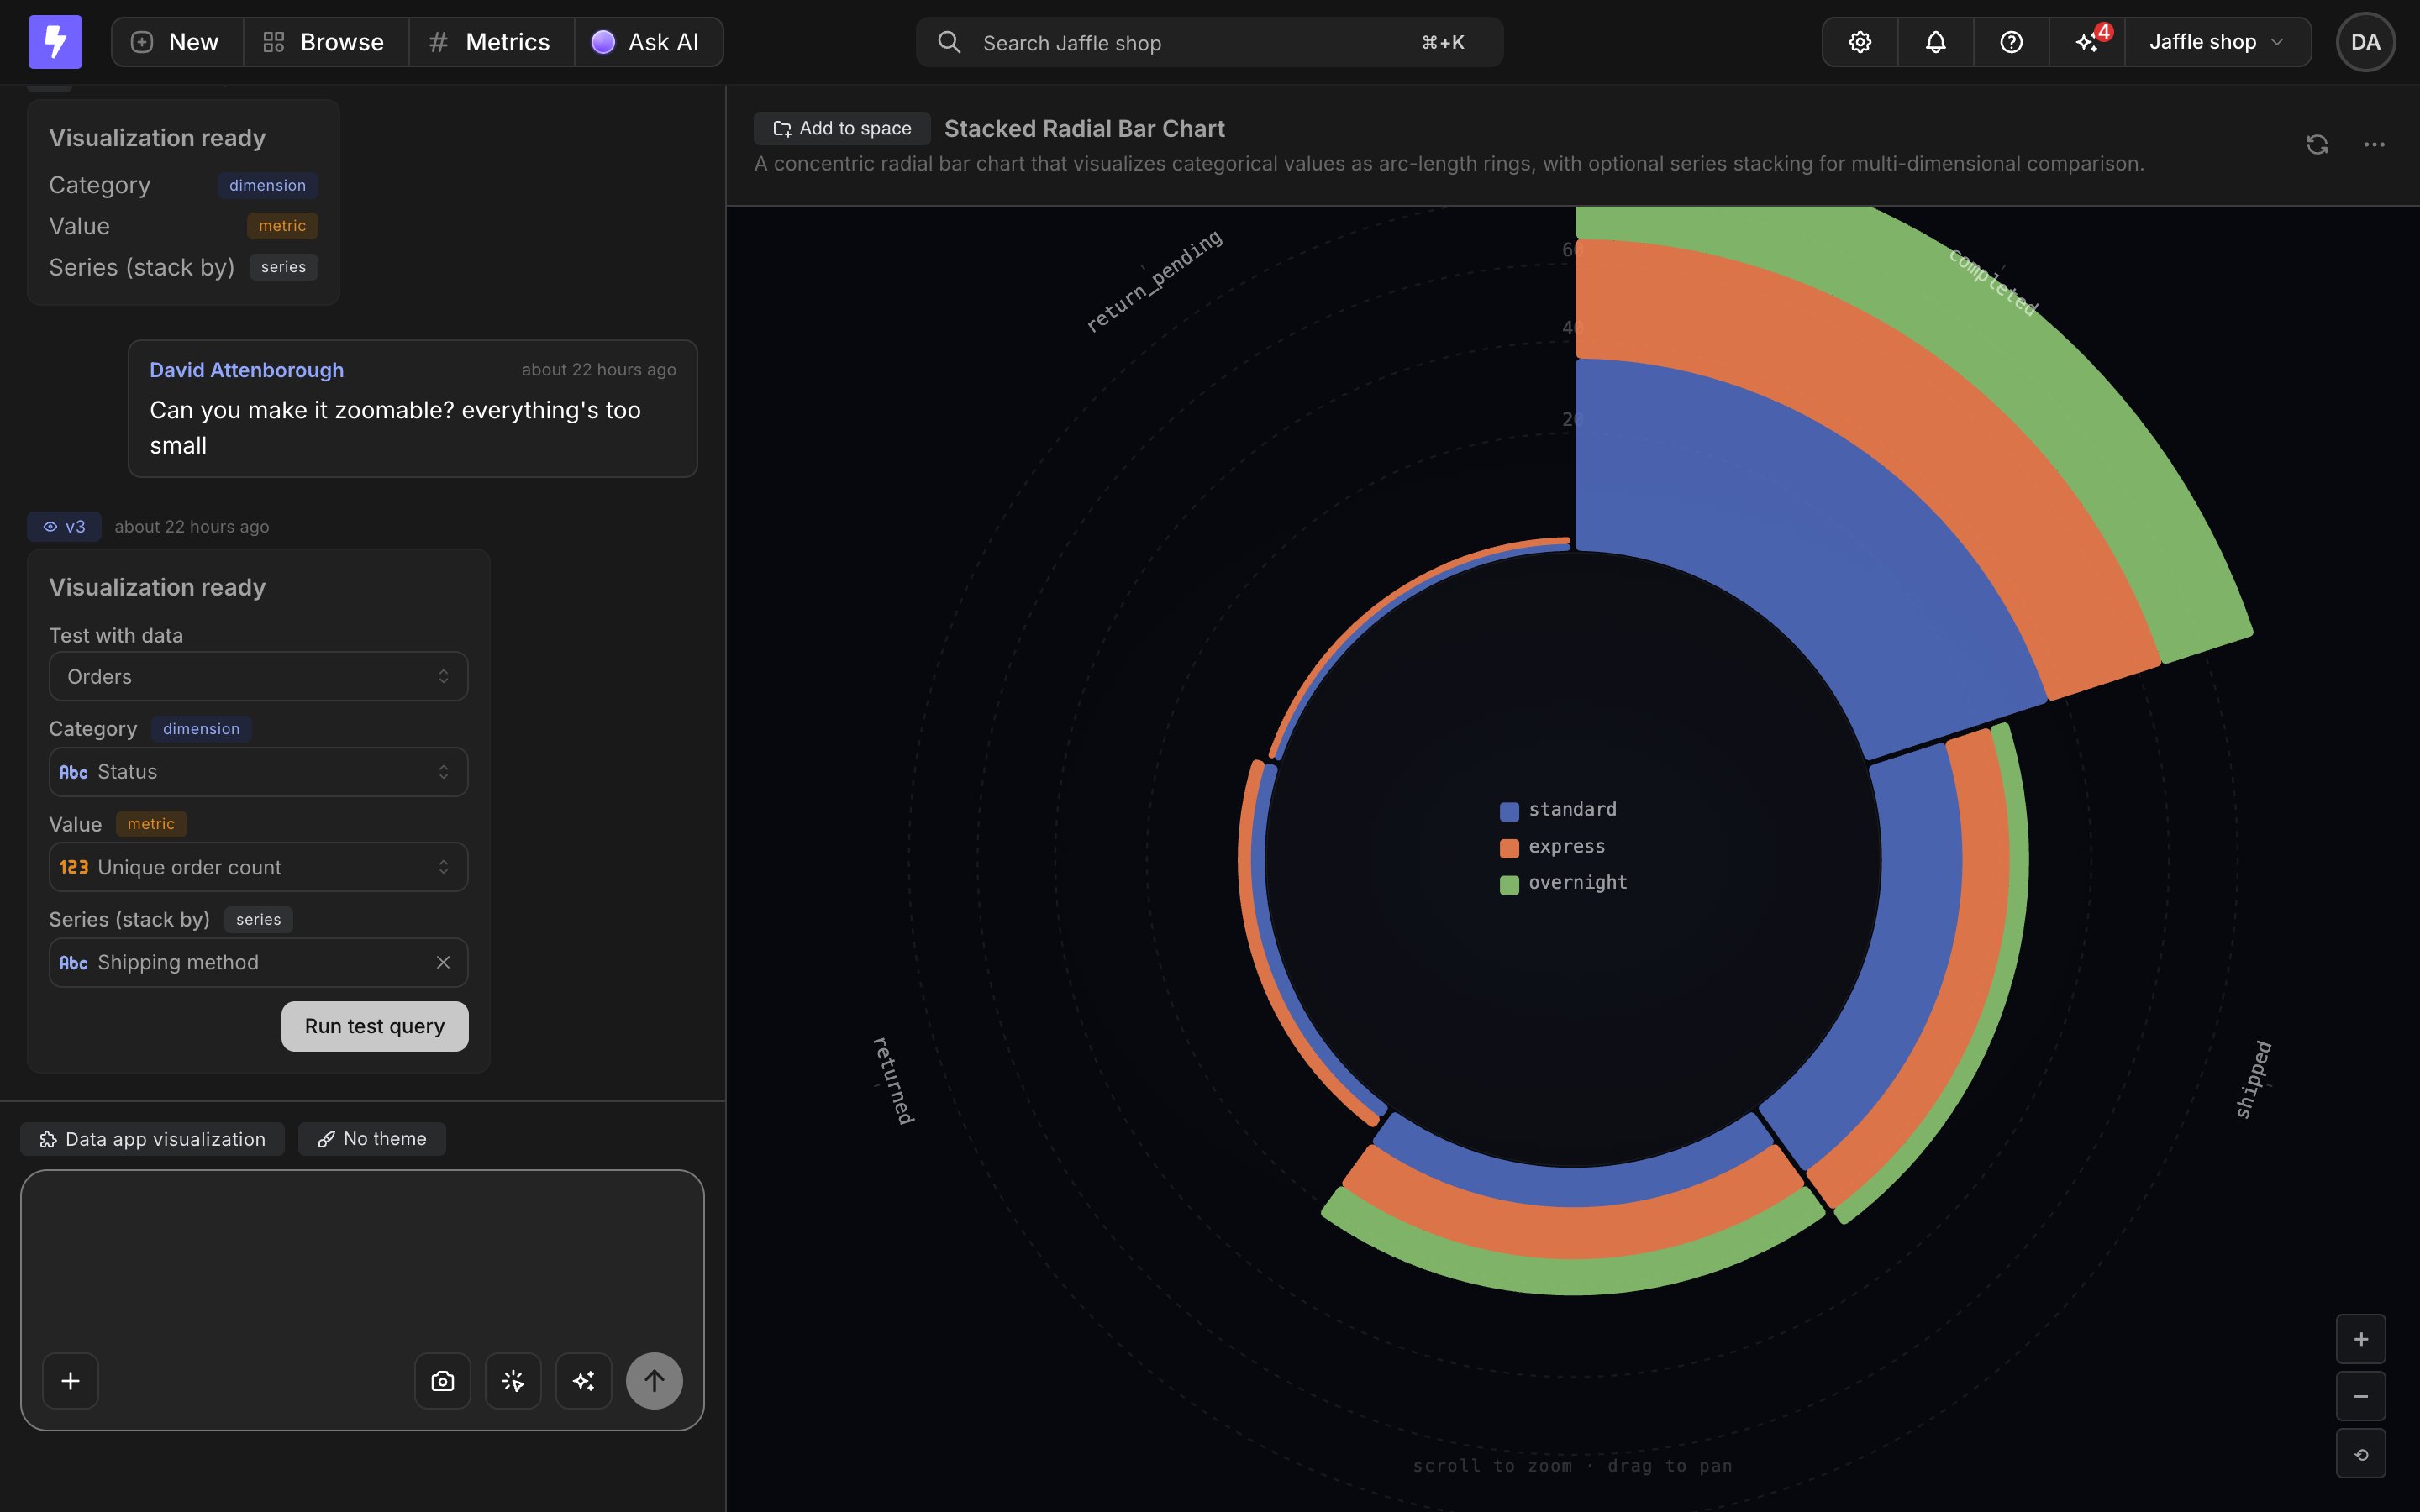
Testing with real data

The result card for the latest version doubles as an interactive test panel, so you can verify the visualization works with your data before using it anywhere:
  1. Pick an explore.
  2. Map each declared field to one of your dimensions or metrics.
  3. The visualization renders live in the preview with real query results.
The Visualization ready result card with the test panel, showing declared fields mapped to explore fields and a live preview
Testing is ephemeral - it never creates a saved chart.

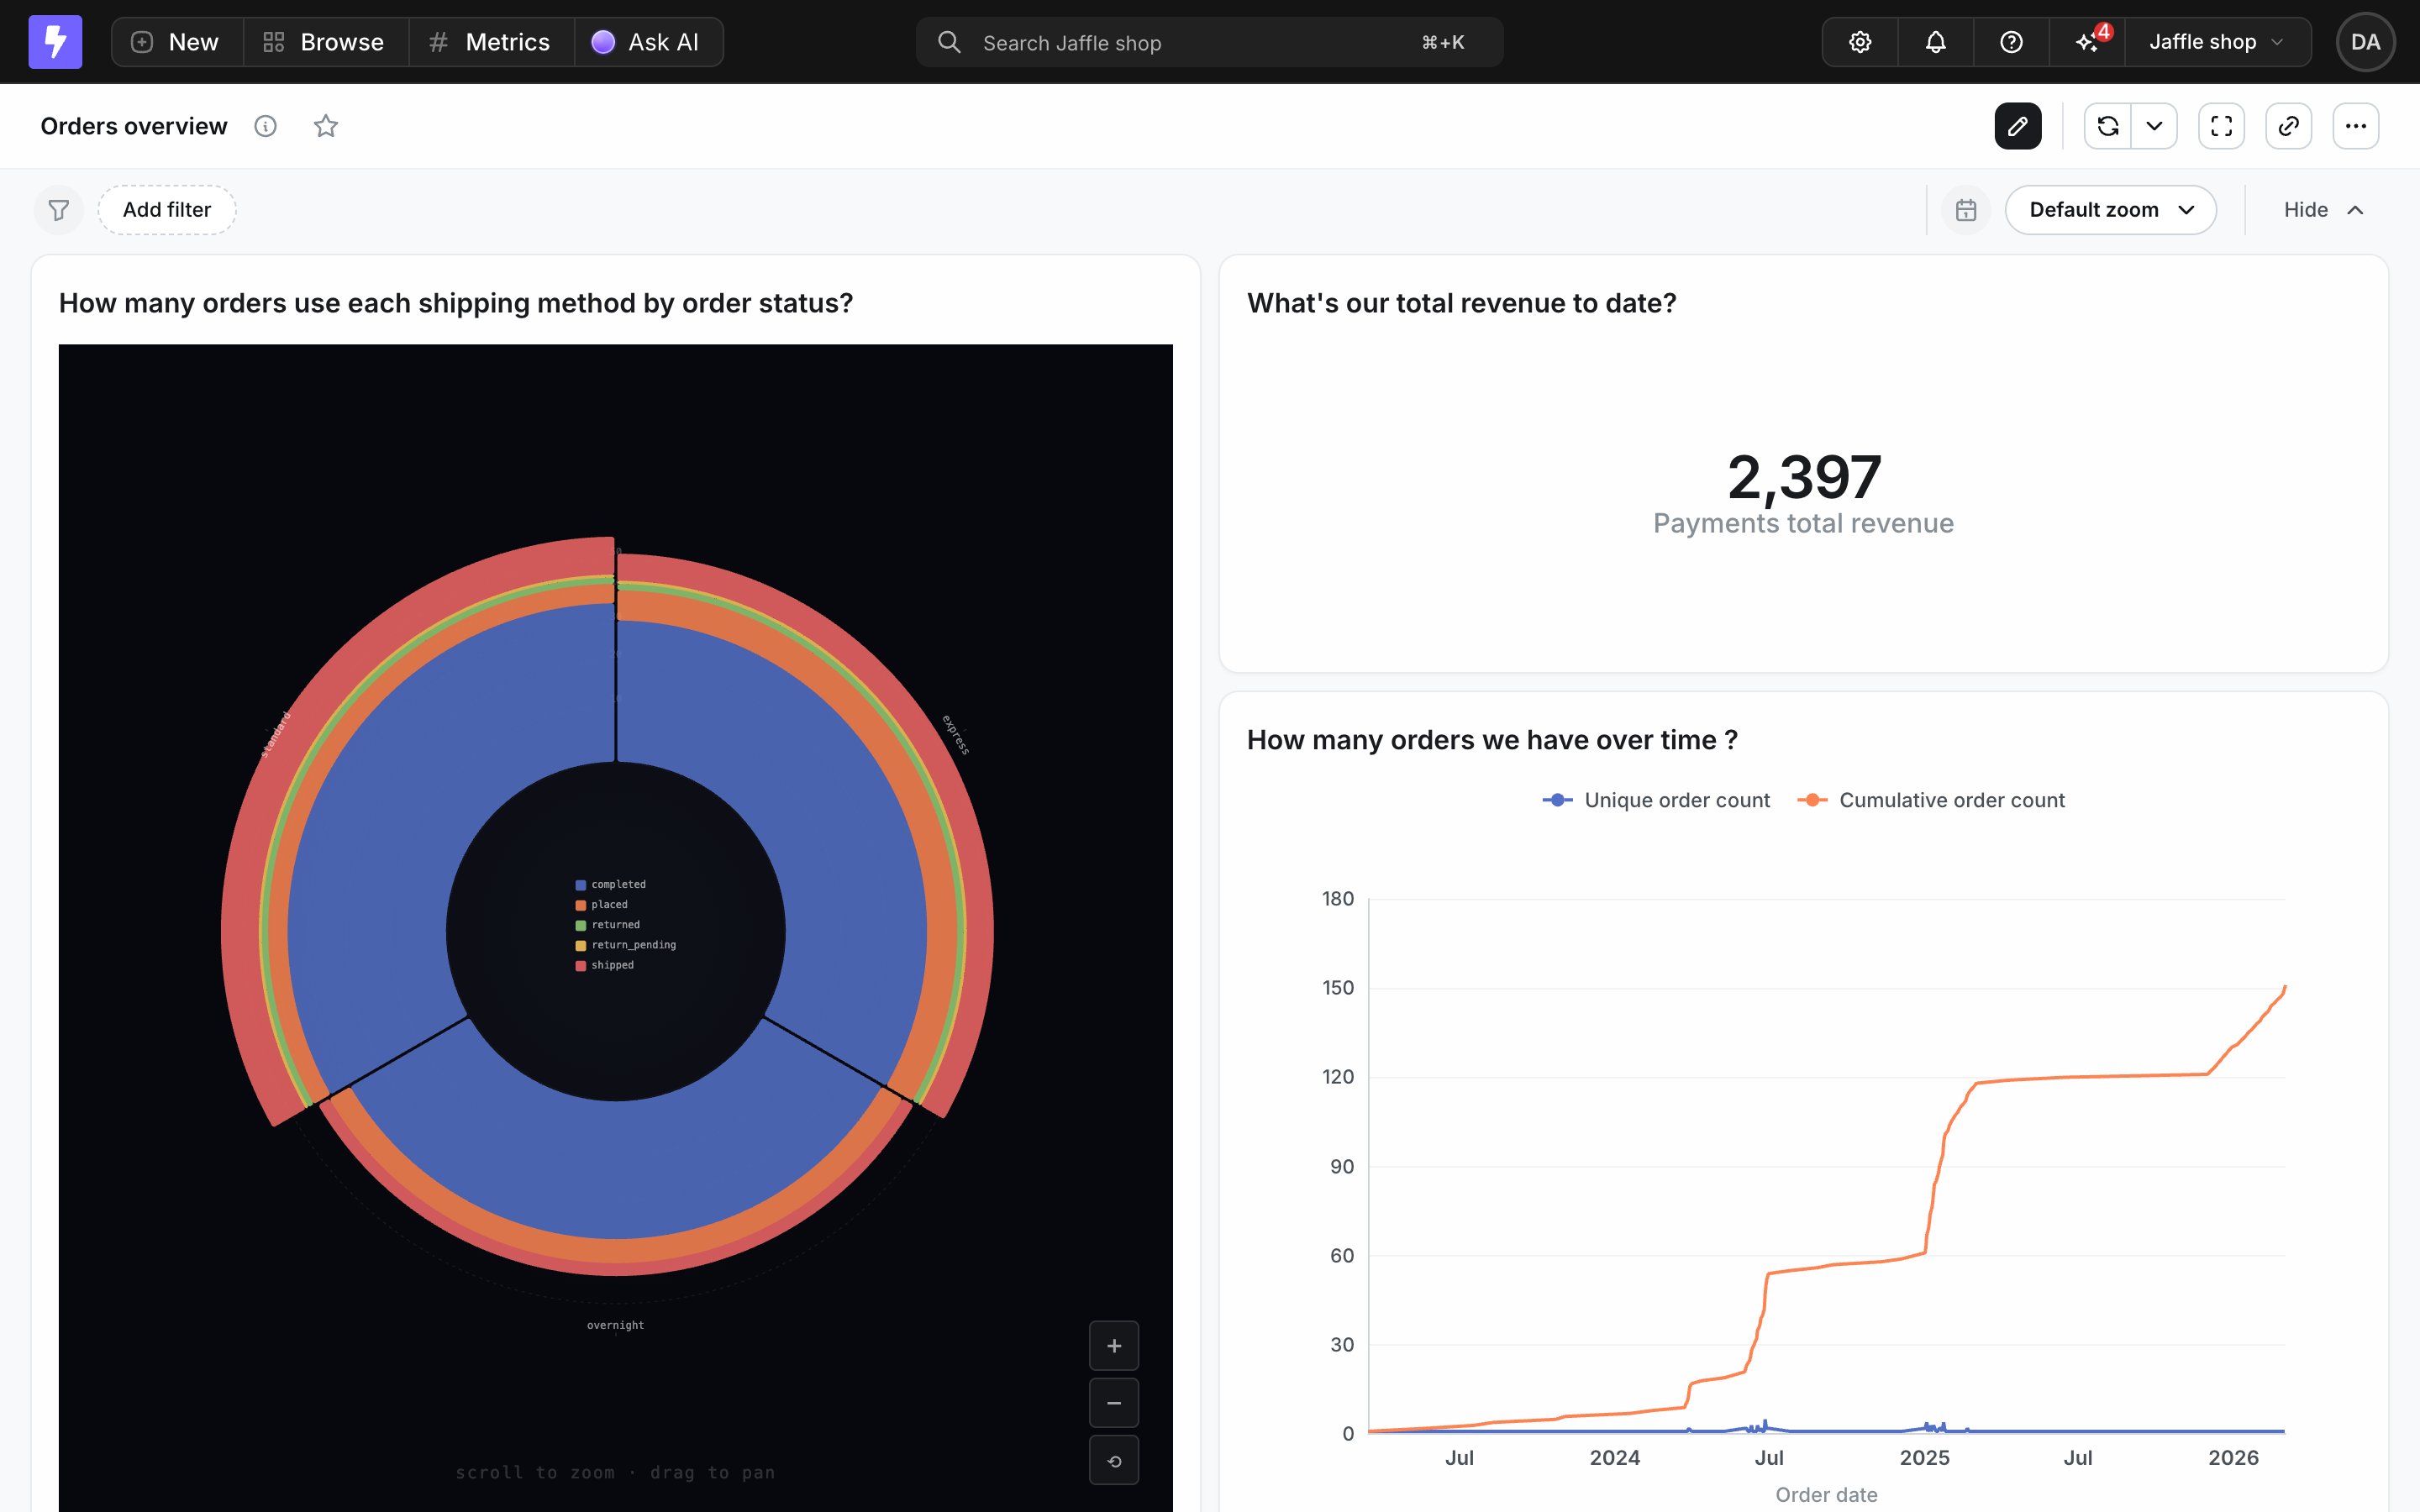
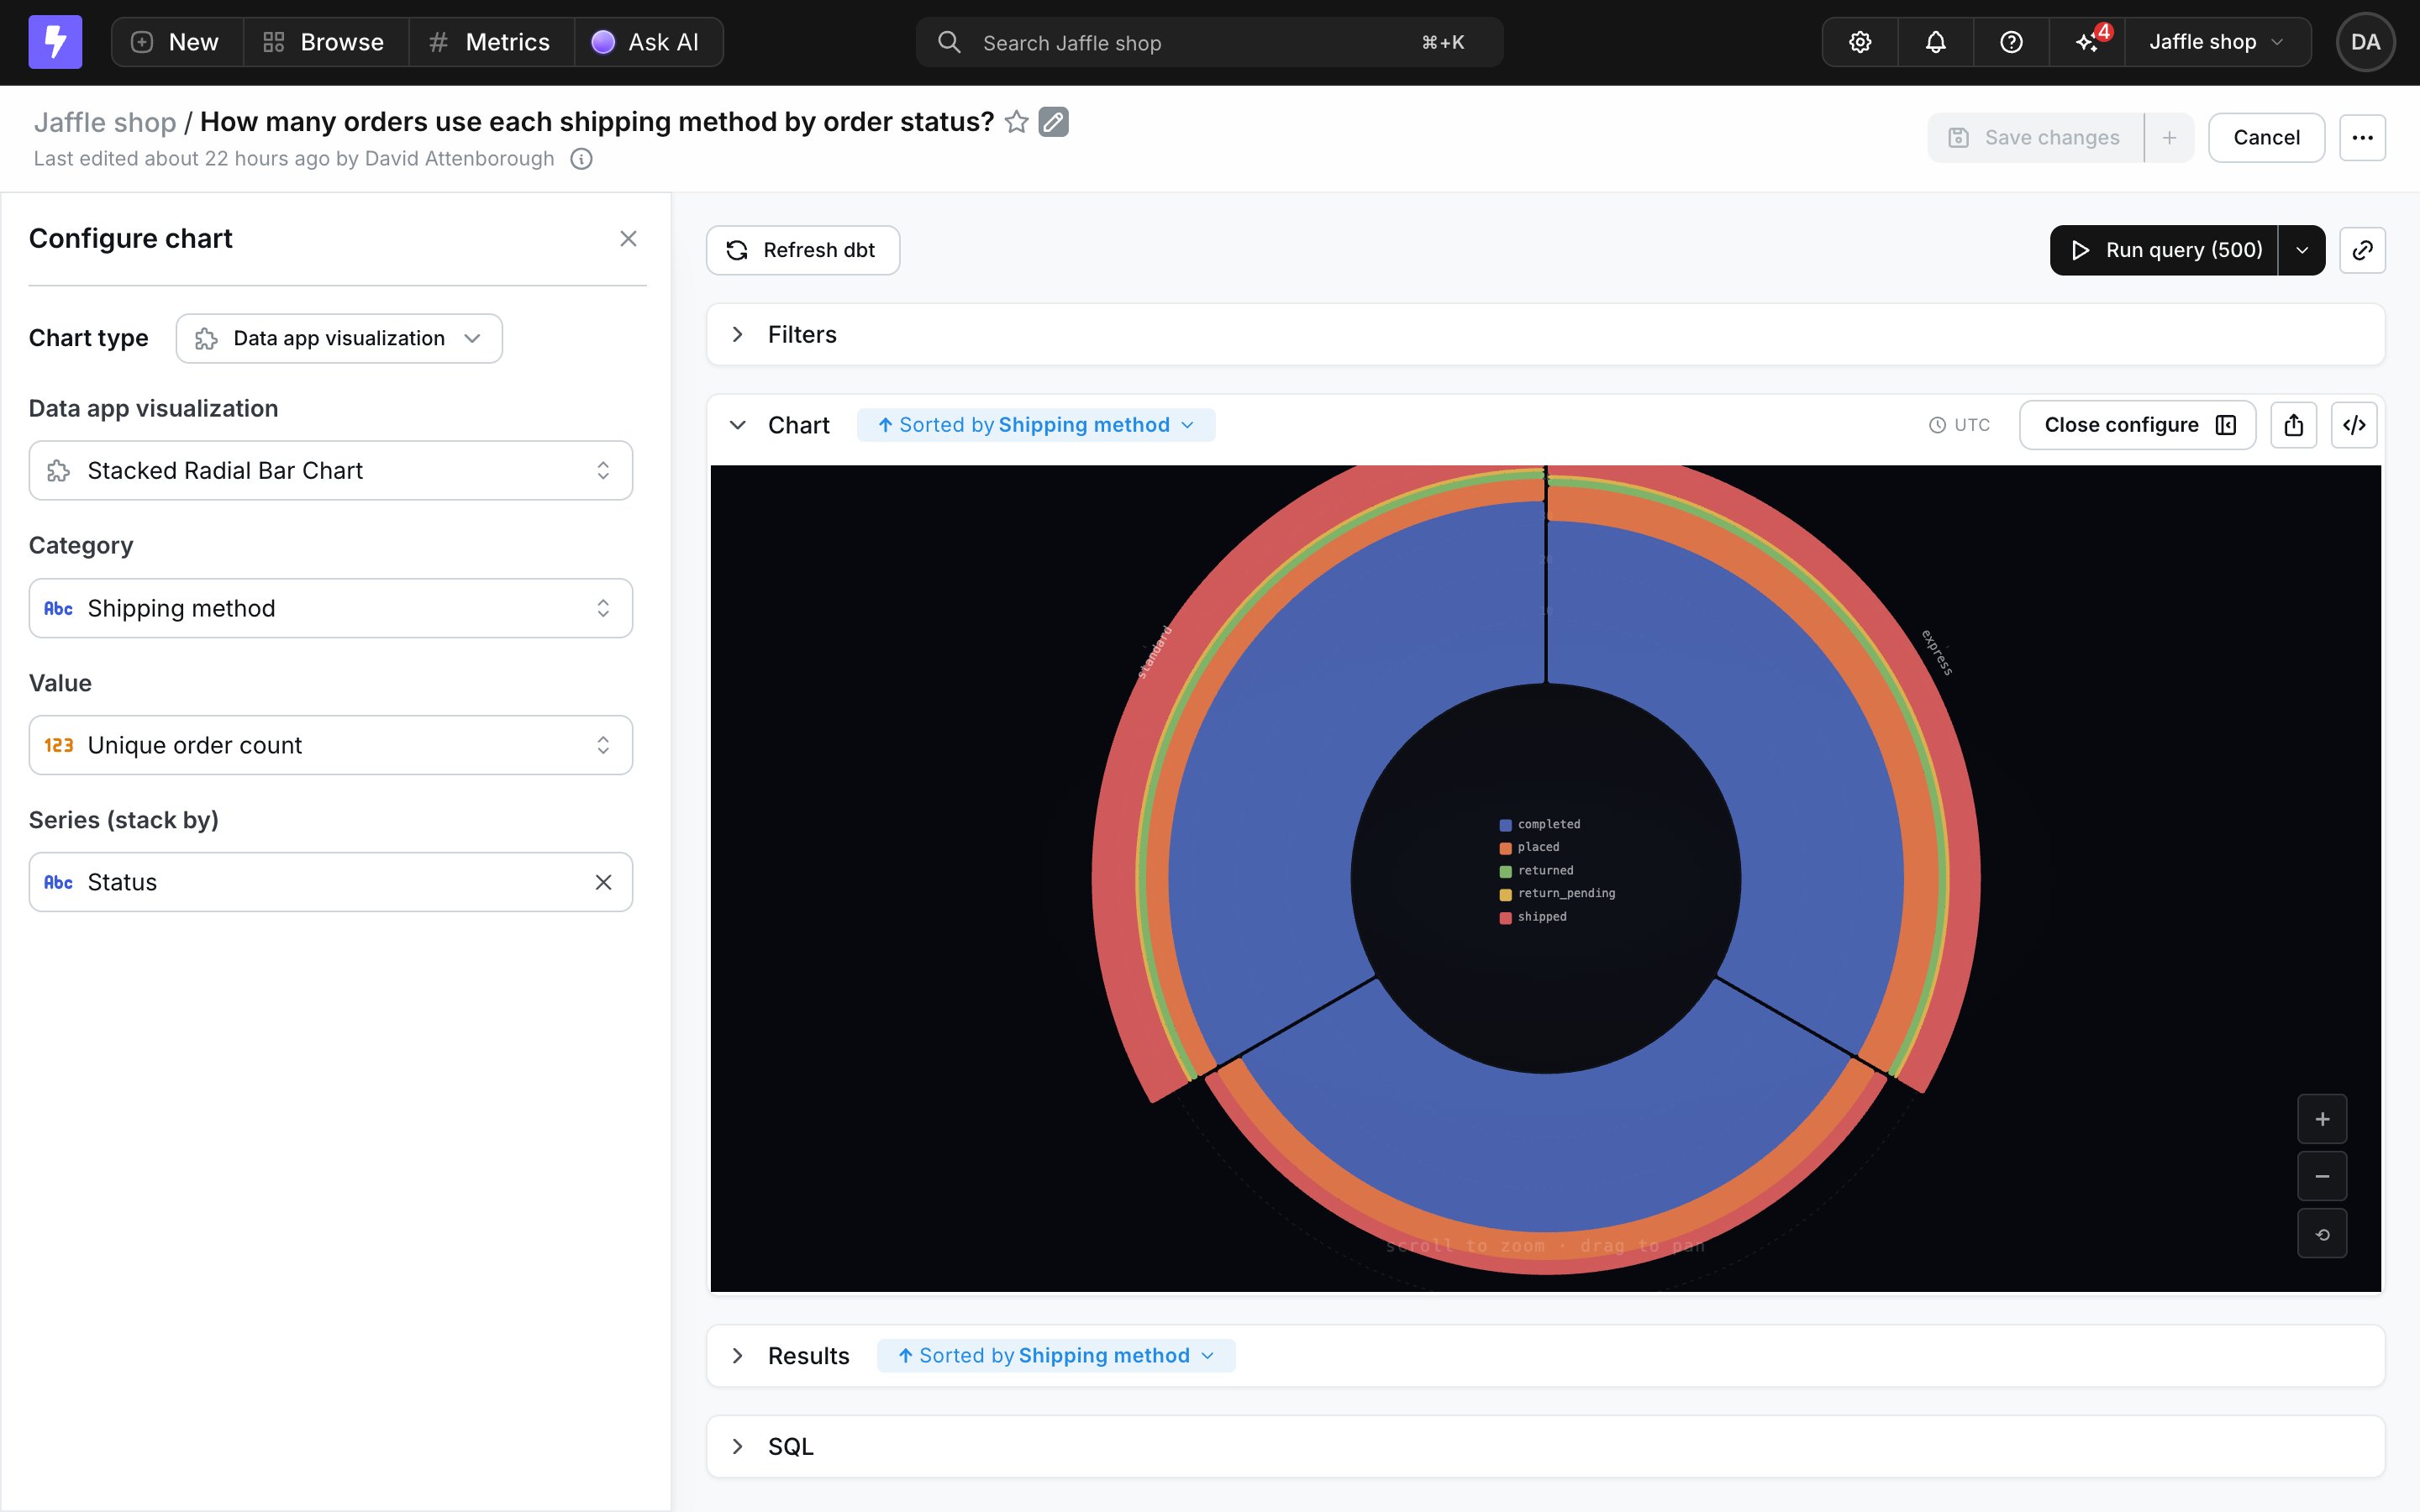
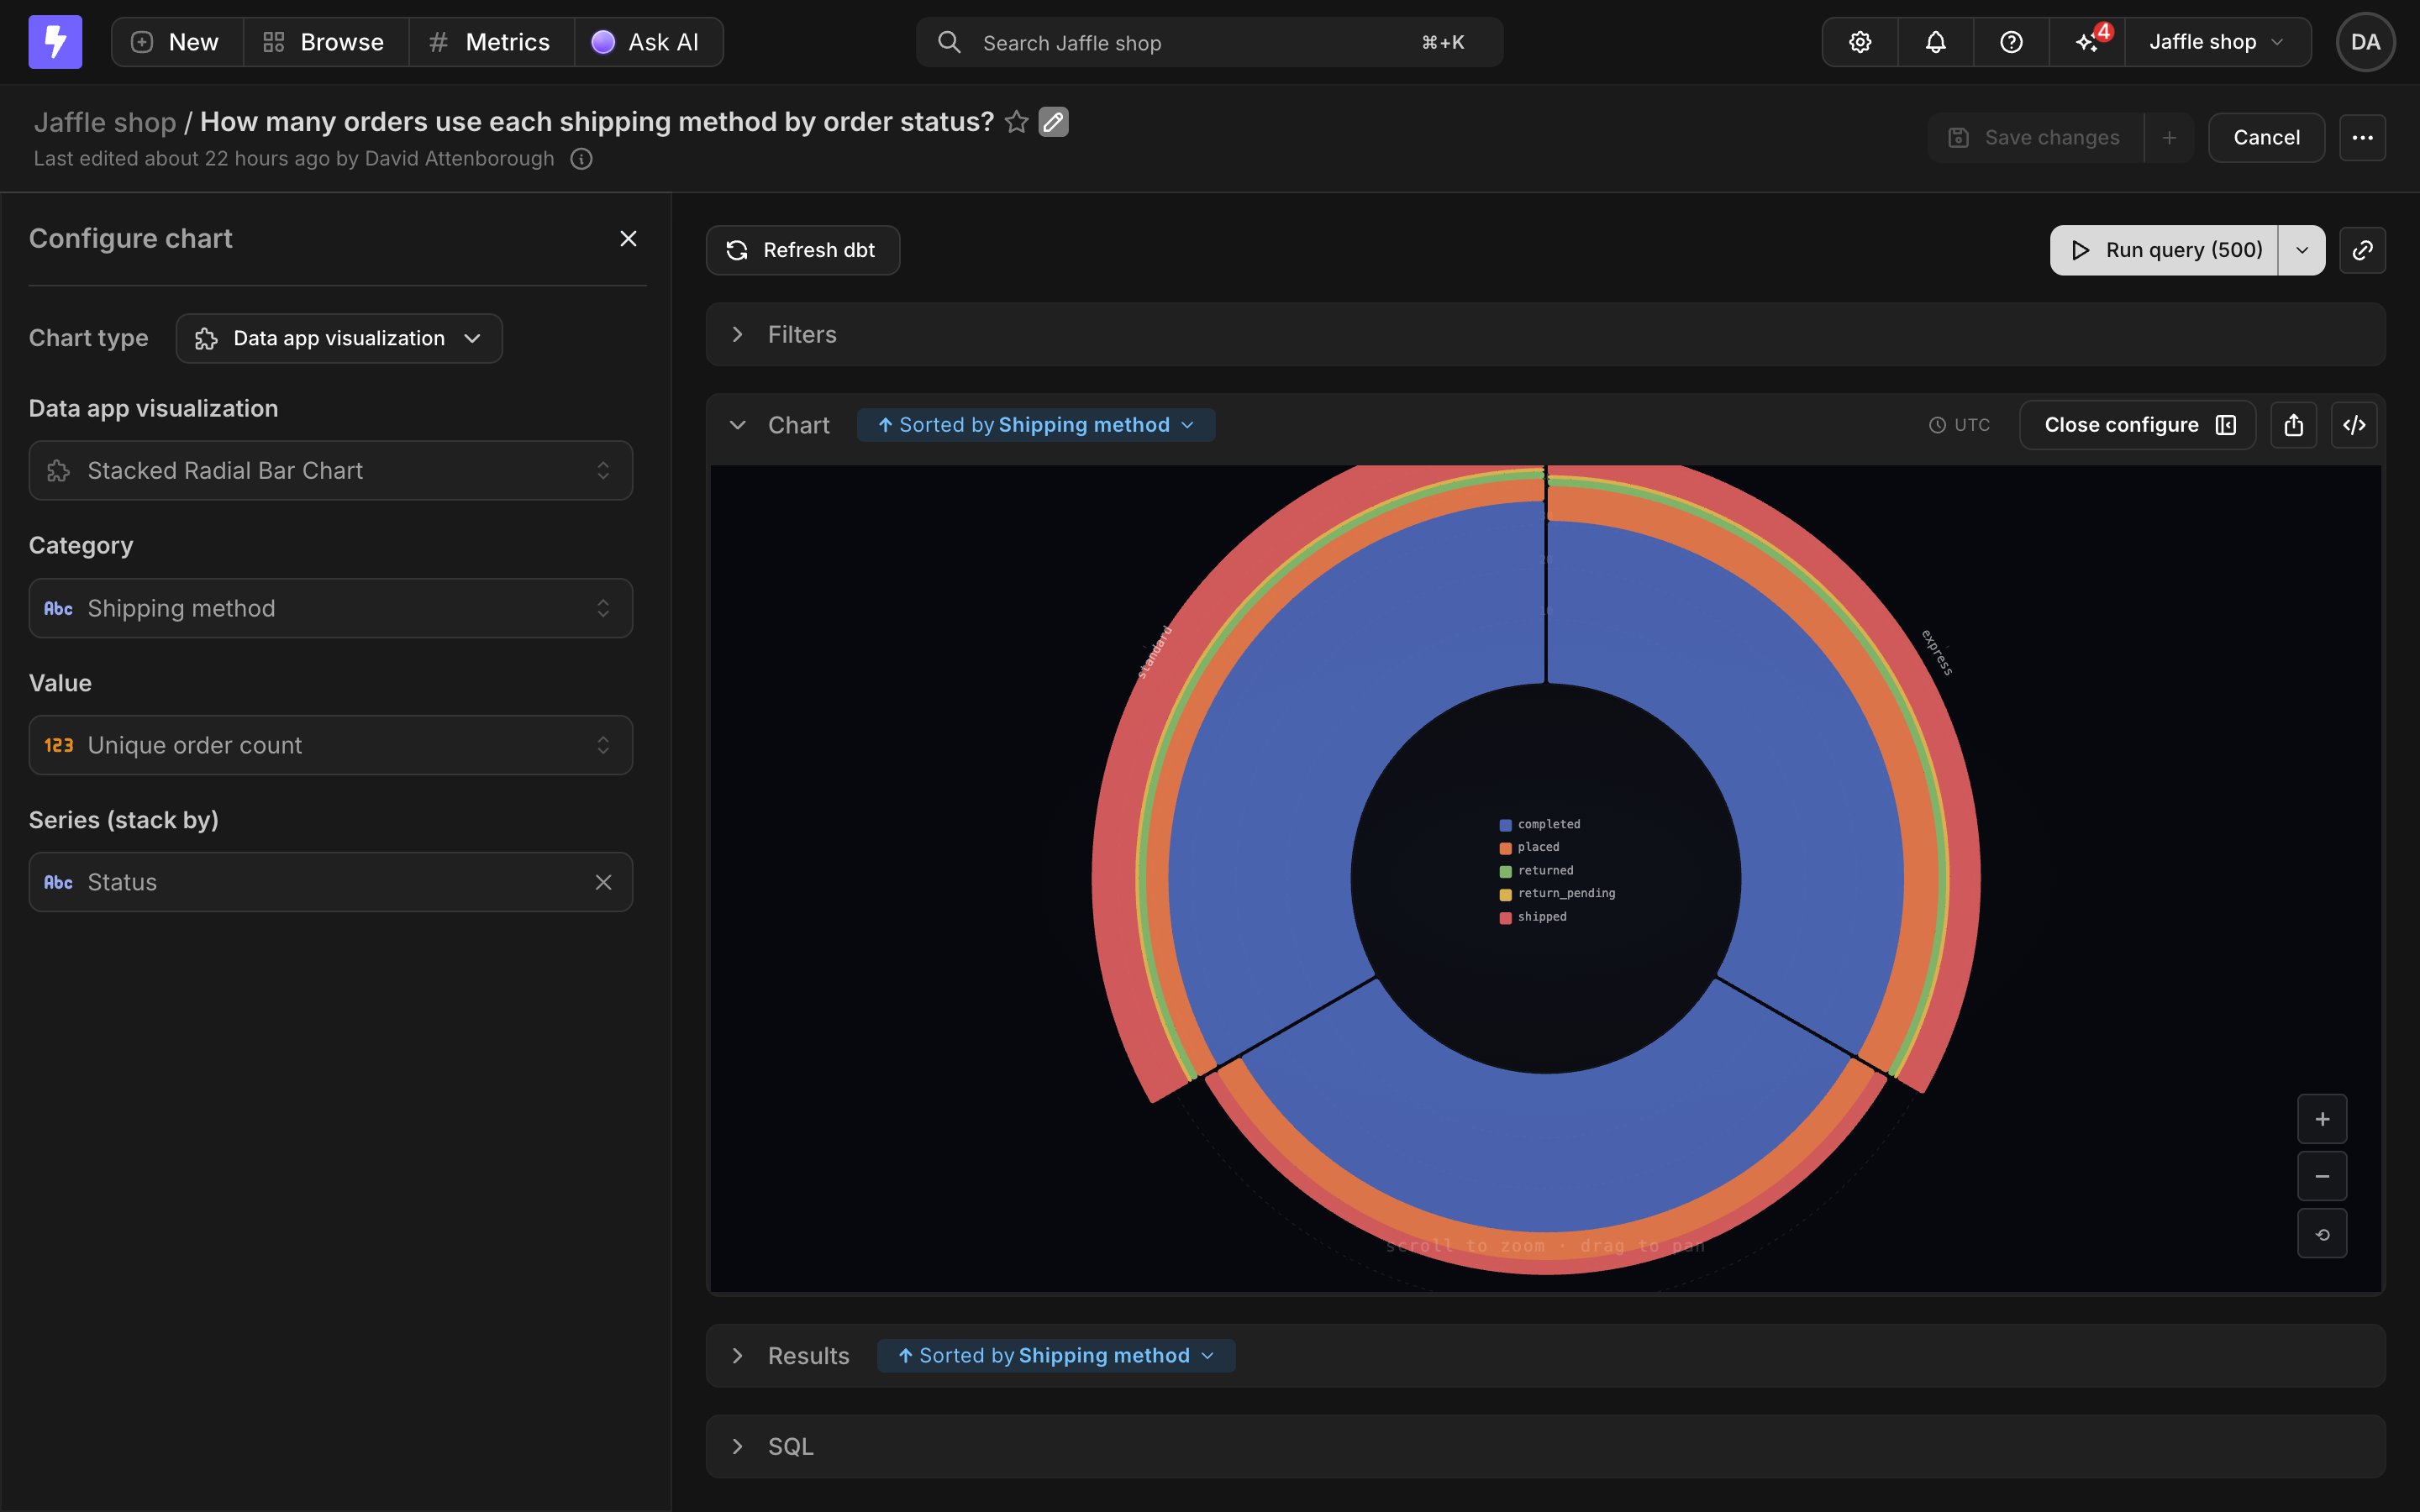
Using a visualization in the Explorer

Once a visualization is saved in your project, it’s available as a chart type in the Explorer:
  1. Run a query.
  2. Open the chart configuration and choose the data app visualization chart type.
  3. Pick a visualization from the searchable dropdown. It lists all visualizations saved in the project; only visualizations that finished generating appear.
  4. Map your query’s fields to the visualization’s declared fields.
Field mapping works just like configuring axes on a bar or line chart: each declared field (for example, Category or Value) gets a field picker, and required fields can’t be cleared.
The Explorer chart configuration with the data app visualization chart type selected, showing the visualization dropdown and field mapping pickers
The visualization renders live against your query results as you change the mapping or the underlying query.

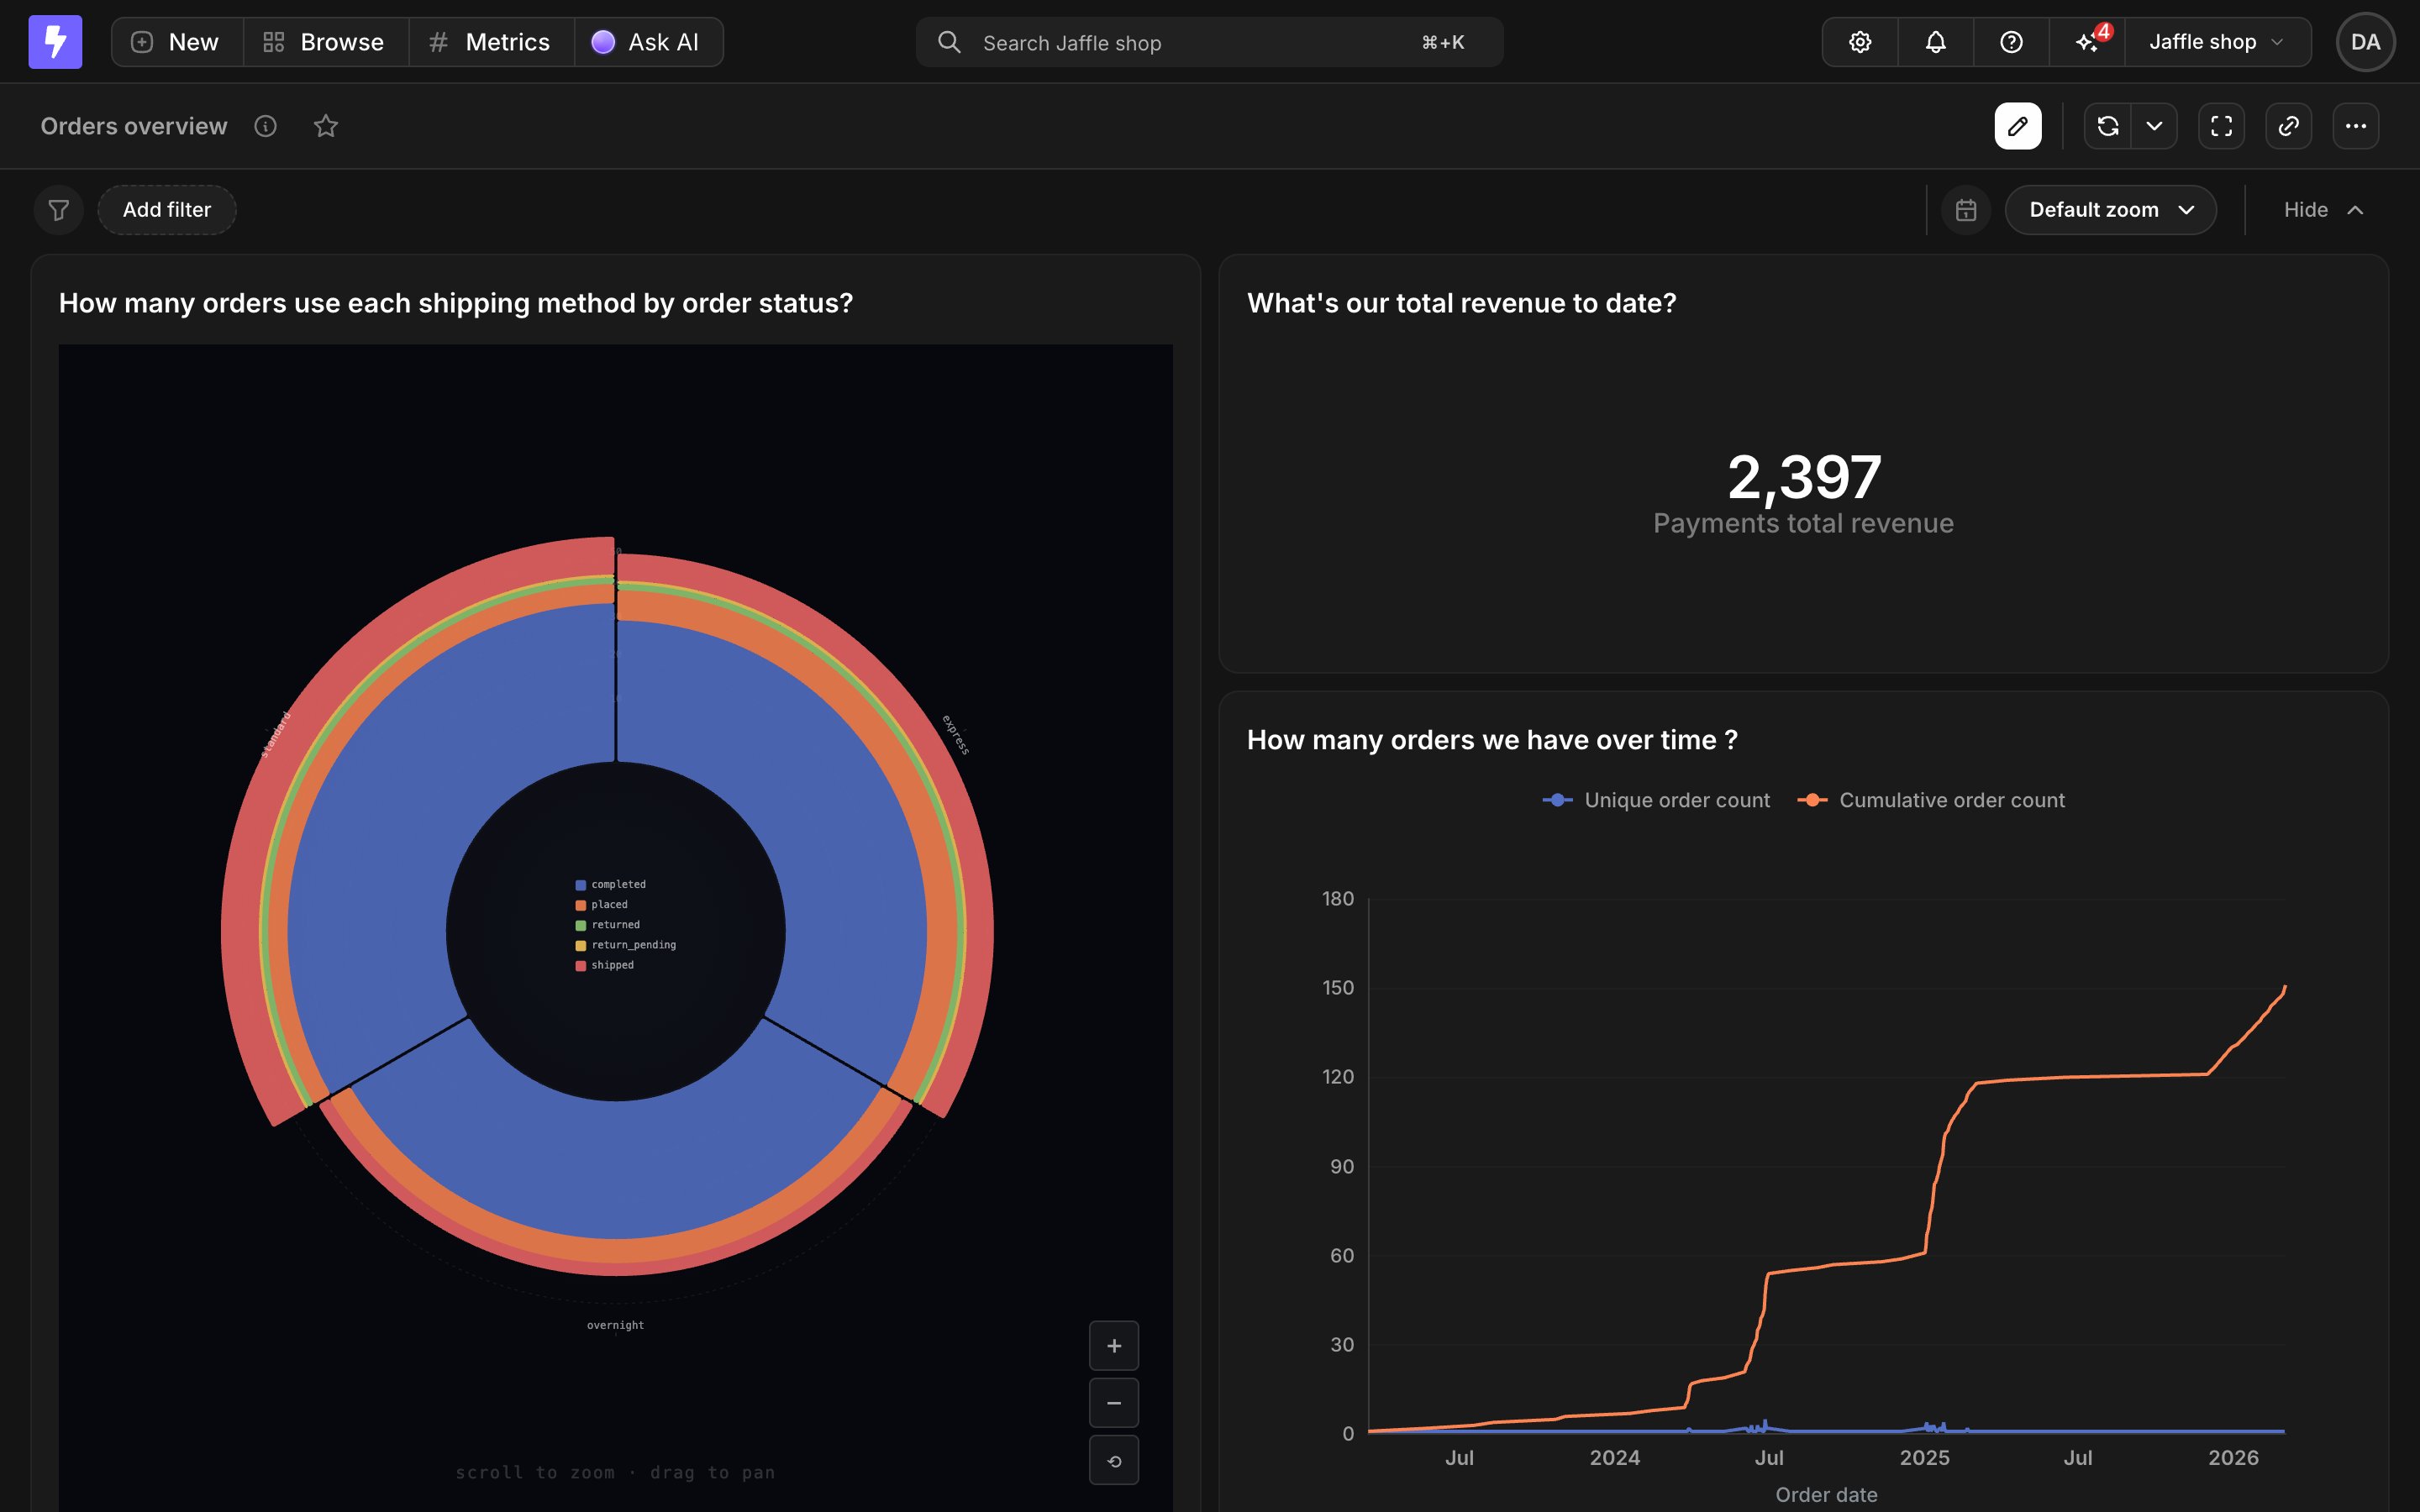
Saving and dashboards

Save the chart like any other chart. The saved chart remembers which visualization it uses and the field mapping. Saved charts render in chart view and as dashboard tiles, driven by each surface’s own query - dashboard filters and date zoom apply like any other chart tile.
A data app visualization rendering as a tile on a dashboard
The same visualization can be reused across many saved charts, each with a different field mapping and a different query.

Permissions

Visualizations follow the same space-based permission model as other data apps. See Data apps permissions for details.